Introduction To Stock Patterns: A Beginner’s Guide
Understanding Stock Patterns: An Overview
As you embark on your journey into the world of stock trading, understanding stock patterns is akin to learning the language of the market. These patterns are like signposts, providing valuable insights into the behavior of stocks. Put simply, stock patterns are graphical representations of a stock’s historical price movements. They reveal the story of how a stock’s value has changed over time, and this story can hold the key to making informed decisions about when to buy or sell.
To grasp the significance of stock patterns, imagine them as blueprints of a stock’s past behavior. By studying these blueprints, traders can identify recurring trends and anticipate potential future movements. For instance, if a stock has a history of forming a ‘double top’ pattern and then experiencing a price drop, recognizing this pattern in real-time could signal an opportunity to sell before the decline. This is the power of understanding stock patterns — it equips you with the ability to make more educated and strategic trading decisions.
Stock patterns are like the hidden language of the stock market. They’re visual representations of past price movements and offer valuable insights into what might happen in the future. These patterns appear on stock charts, and they’re not just random squiggles. They follow specific formations that traders use to predict price direction.
Now, let’s visually dive into some common types of stock patterns. Take a look at the example below to see how these patterns manifest on a stock chart.
The Role of Technical Analysis in Stock Trading
Technical analysis plays a crucial role in stock trading, helping traders make informed decisions about when to buy or sell stocks. It’s like having a secret decoder for the stock market. This method involves analyzing historical price charts and trading volumes to predict future stock price movements. It helps traders identify patterns and trends that can guide their decisions.
One essential concept in technical analysis is the use of charts and indicators. These tools provide visual representations of a stock’s price history, making it easier to spot patterns and trends. Some commonly used indicators include moving averages, RSI (Relative Strength Index), and MACD (Moving Average Convergence Divergence). These indicators help traders understand whether a stock is overbought (too expensive) or oversold (a potential bargain).
Technical analysis also helps traders identify support and resistance levels, which are key price points where a stock often changes direction. By recognizing these levels, traders can make better decisions on when to buy low and sell high.
Why Stock Patterns Matter for Beginners?
Now, you might wonder why you, as a beginner, should care about stock patterns. Well, let’s break it down:
- Simplicity: Stock patterns offer a straightforward way to analyze stocks without diving into complex financial statements and reports. If you can spot basic shapes and lines on a chart, you can get started.
- Visual Clarity: They provide a clear visual representation of price movements, making it easy for beginners to grasp trends and reversals.
- Historical Significance: These patterns are based on historical price movements. Understanding them allows you to learn from the past and apply that knowledge to future trading decisions.
- Risk Management: By recognizing patterns, you can set stop-loss orders, which help you limit potential losses and manage risk effectively.
- Confidence Building: Successfully identifying patterns boosts your confidence as a trader and empowers you to make decisions based on a well-defined strategy.
In short, stock patterns are a beginner’s best friend in the stock market. They simplify the complex world of trading and provide you with a solid foundation for making informed investment decisions.
Commonly Used Stock Patterns
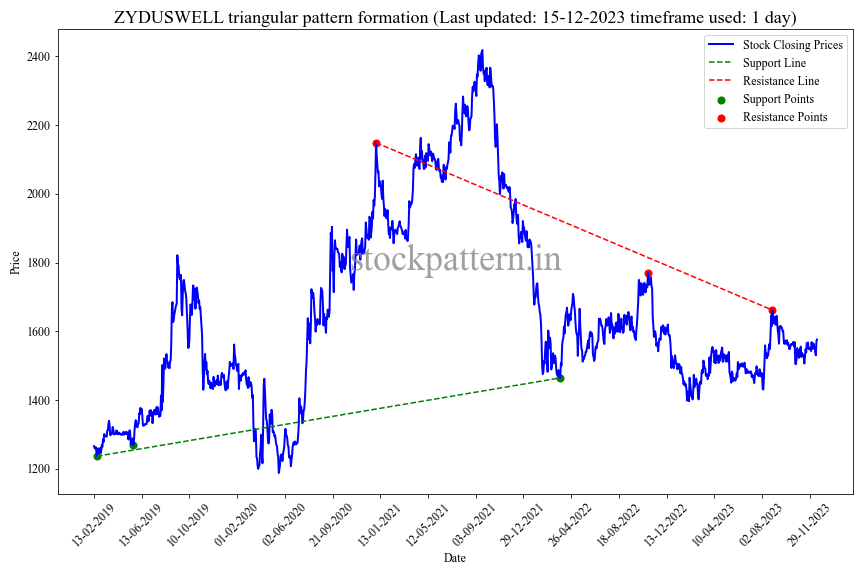
1. Triangular Patterns
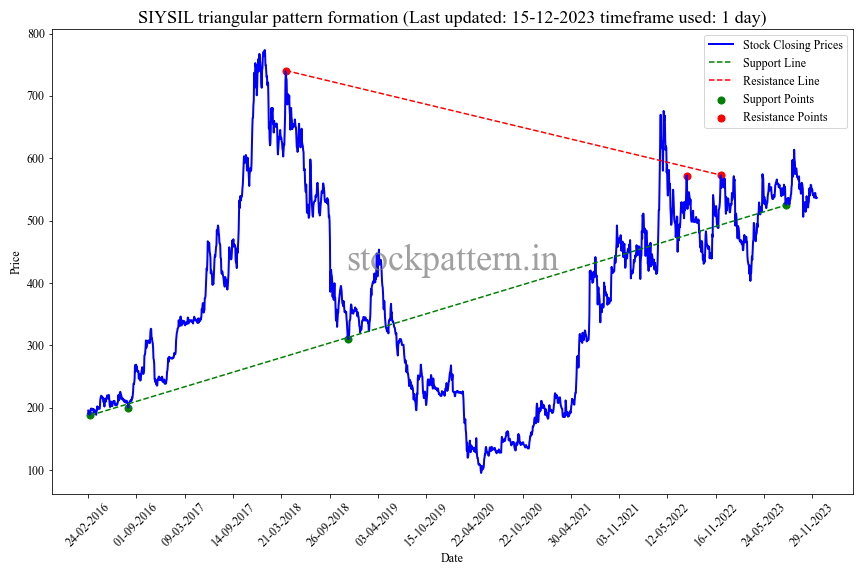
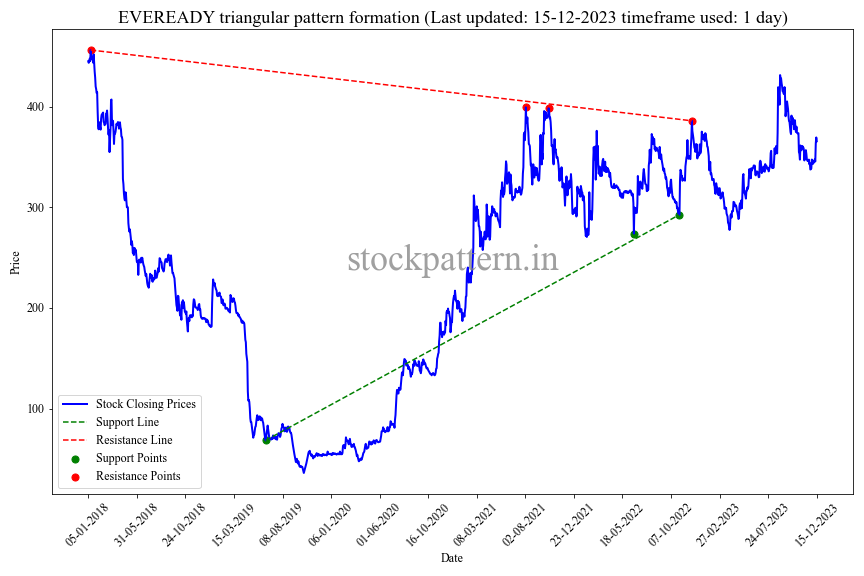
- Symmetrical Triangles: These form when the stock’s price moves within converging trendlines.
- Ascending Triangles: Characterized by a horizontal resistance line and an ascending support line.
- Descending Triangles: Consist of a horizontal support line and a descending resistance line.
2. Channel Patterns
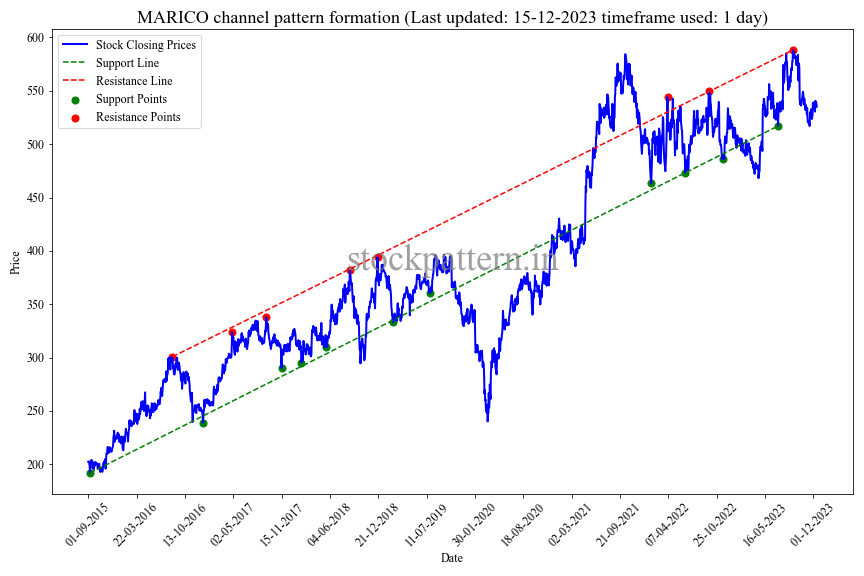
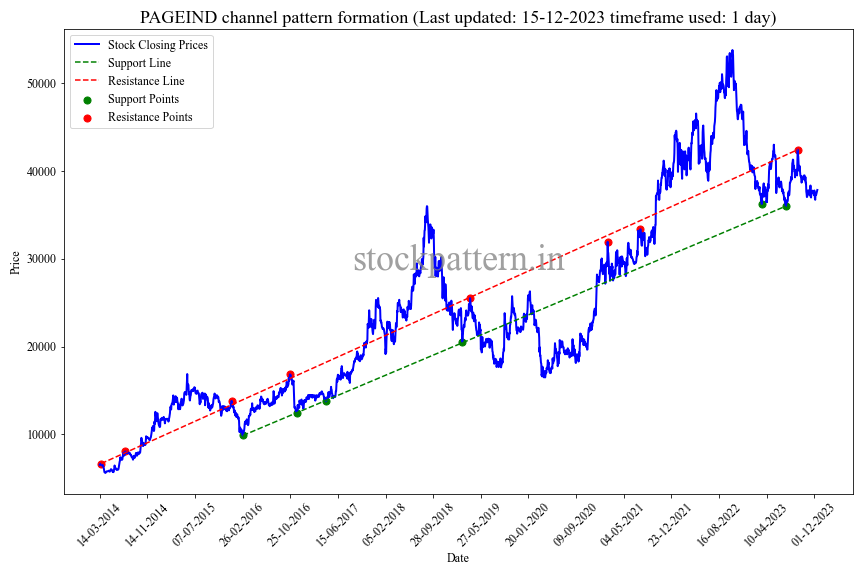
Stocks often move within parallel lines, creating upward, downward, or horizontal channels.
3. Wedge Patterns
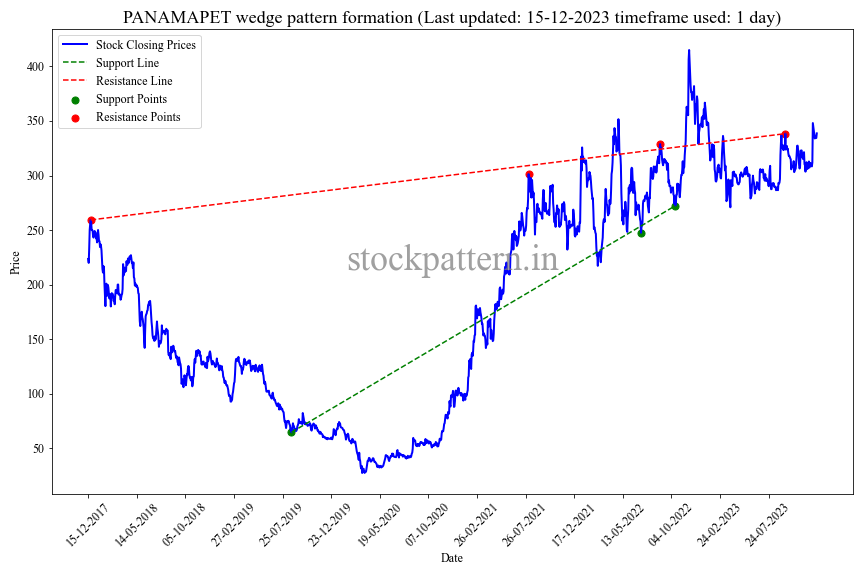
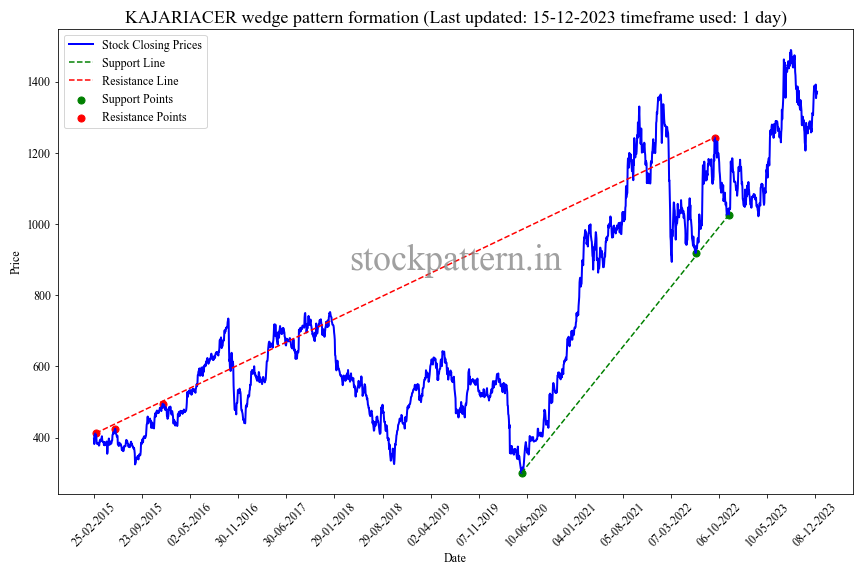
Wedges are similar to triangles but are typically shorter in duration and can be ascending or descending.
4. Head and Shoulders Patterns
This pattern resembles a head and two shoulders and often indicates a trend reversal.
5. Double Top and Double Bottom Patterns
A double top suggests a bearish reversal, while a double bottom indicates a bullish reversal.
6. Cup and Handle Patterns
This bullish pattern resembles a teacup and handle, signifying a potential breakout.
7. Flag and Pennant Patterns
These are short-term consolidation patterns that signal potential breakout opportunities.
Trends and Trendlines
Stock patterns are closely tied to trends, so understanding how to identify them is crucial.
Trends are like the heartbeat of the stock market. They indicate the general direction in which a stock’s price is moving. There are three main types of trends:
1. Uptrend
When a stock’s price is consistently moving upward, it’s called an uptrend. This signifies a bullish stock.
2. Downtrend
When the price is consistently moving downward, it’s a downtrend, indicating a bearish market.
3. Sideways Trend
Sometimes, prices move neither significantly up nor down, creating a sideways trend, also known as a range-bound market.
Chart Timeframes
Understanding different chart timeframes is essential because it allows you to zoom in or out on a stock’s price action. Here are the most common chart timeframes:
1. Daily
Shows one day’s price data per candlestick. Useful for short-term traders.
2. Weekly
Each candlestick represents one week, providing a broader perspective for medium-term traders.
3. Monthly
Monthly charts offer a long-term view, ideal for investors with a horizon spanning months or years.
Psychology of Stock Patterns: What Drives Market Behavior?
Understanding the psychology behind stock patterns is vital for every novice trader. It helps you grasp why markets move the way they do and make more informed decisions. Market behavior is driven by human emotions, and this is a key concept in stock trading.
When prices rise, it often triggers “greed” among investors. They fear missing out on profits and buy more, causing an uptrend. On the flip side, when prices fall, “fear” sets in, leading to panic selling and downtrends. This emotional rollercoaster creates patterns on stock charts, like the well-known “head and shoulders” or “double bottom.” Recognizing these patterns is crucial because they represent collective human sentiment. By understanding whether the market is driven by optimism or fear, you can better predict its next move and make more profitable trades.
Remember, the market’s emotions are your allies and enemies in trading. By learning to decode them through stock patterns, you gain a powerful tool in your trading arsenal.
How to Recognize and Trade Stock Patterns
Recognizing and trading stock patterns is a crucial skill for anyone looking to invest in the stock market. These patterns are like the secret code of the market, and once you understand them, you can make more informed decisions. Here’s a beginner-friendly guide on how to recognize and trade stock patterns effectively.
1. Start with the Basics
Before diving into complex patterns, get comfortable with the most common ones, like the ‘head and shoulders,’ ‘double top,’ and ‘double bottom.’ These patterns often indicate trend reversals or continuations. You can find them on stock charts, which are readily available on trading platforms and websites.
2. Learn to Identify Trends
Successful pattern recognition begins with understanding the market trend. Patterns are usually categorized as bullish (indicating a potential price increase) or bearish (indicating a potential price decrease). Recognizing the current trend helps you choose the right pattern to trade.
3. Practice and Patience
Don’t rush. It takes time to become proficient in spotting patterns. Regular practice is key. Use historical data to identify patterns and study their outcomes. Many traders find it helpful to use pattern recognition tools or software to assist in this process.
As you get more experienced, you can create your own strategies based on the patterns you’ve learned. Remember that trading involves risk, so it’s essential to manage your investments carefully and never invest more than you can afford to lose. With dedication and a thorough understanding of stock patterns, you’ll be better equipped to make informed trading decisions. And, over time, you can increase your chances of success in the stock market. Good luck!
Conclusion
In conclusion, this beginner’s guide has provided a foundational understanding of stock patterns and their significance in the world of trading and investing. We’ve explored the essential concepts behind technical analysis, delved into various common stock chart patterns, and learned how to apply this knowledge to make informed trading decisions.
As you embark on your journey into the world of stock patterns, it’s crucial to remember that success in the stock market requires a combination of knowledge, discipline, and patience. While this guide has introduced you to the basics, there is a wealth of resources and strategies to explore further. Continued learning, practice, and real-world experience will refine your ability to recognize and act upon stock patterns effectively.
Stock patterns are like a secret code that the market reveals to those who know how to interpret them. By mastering these patterns and utilizing resources like stockpattern.in you can navigate the complexities of trading and investing more effectively.
Ultimately, stock patterns are just one facet of the complex and dynamic world of financial markets. Your investment decisions should always be well-informed, and you should consider consulting with financial professionals, conducting thorough research, and managing risks diligently. By keeping these principles in mind and building on the foundation you’ve gained here, you can work toward becoming a more confident and proficient stock trader or investor. Happy trading!